
Pilot Study
In this article we will look at how we can predict which phrase the participant will say by looking at the neural data (MEG). Unlike passive reading task (cf. MOUS dataset section) active reading involves additional step of artefact removal because speaking causes muscle movement which produce (very large) electromagnetic signal.
We will see that MEG signal contains information about which phrase is about to be produced. We will also discuss what this means for our understanding of how brain works during speech production.
1. Introduction
In the general introductory section we discussed why we want to apply Machine Learning to MEG data. In this section we will concretely work with data acquired during a pilot experiment.
The pilot experiment was conducted in ordered to assess effect of muscle artefacts during speech production. This point is not central to our discussion except that it involves extra preprocessing step to remove this artefact.
Our goal, as before, is to identify when and where information about mental representation of the phrases (noun or verb) becomes available.
2. Setup of the Experiment
2.1. Stimuli
The stimuli was adapted from previous study to speed up the setting up cost. They are 240 noun or verb phrases (120 each). Phrases rather than individual words were chosen because, without syntactic context, there tend not be any category specific responses. Nouns are preceded by possessive adjectives (e.g. “ma”, my) and verbs are preceded by pronouns (e.g. “je”, I).
2.2. Task
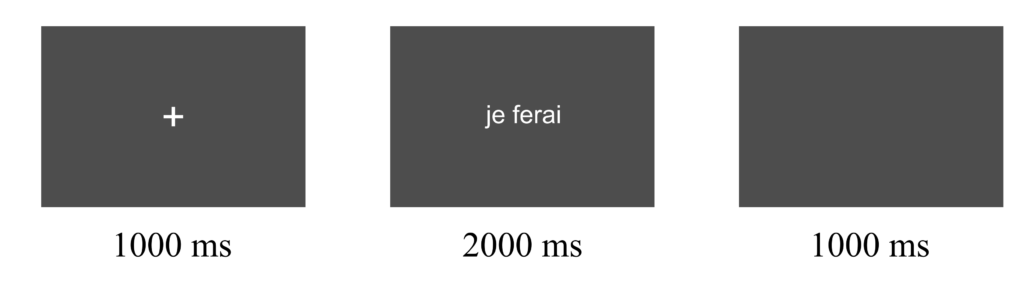
The task of the participant was to read out loud the phrases that appear on the screen as shown below.
2.3. Regions of Interest (ROIs) and Whole Brain
In order to analyse the data, two different approaches were taken.
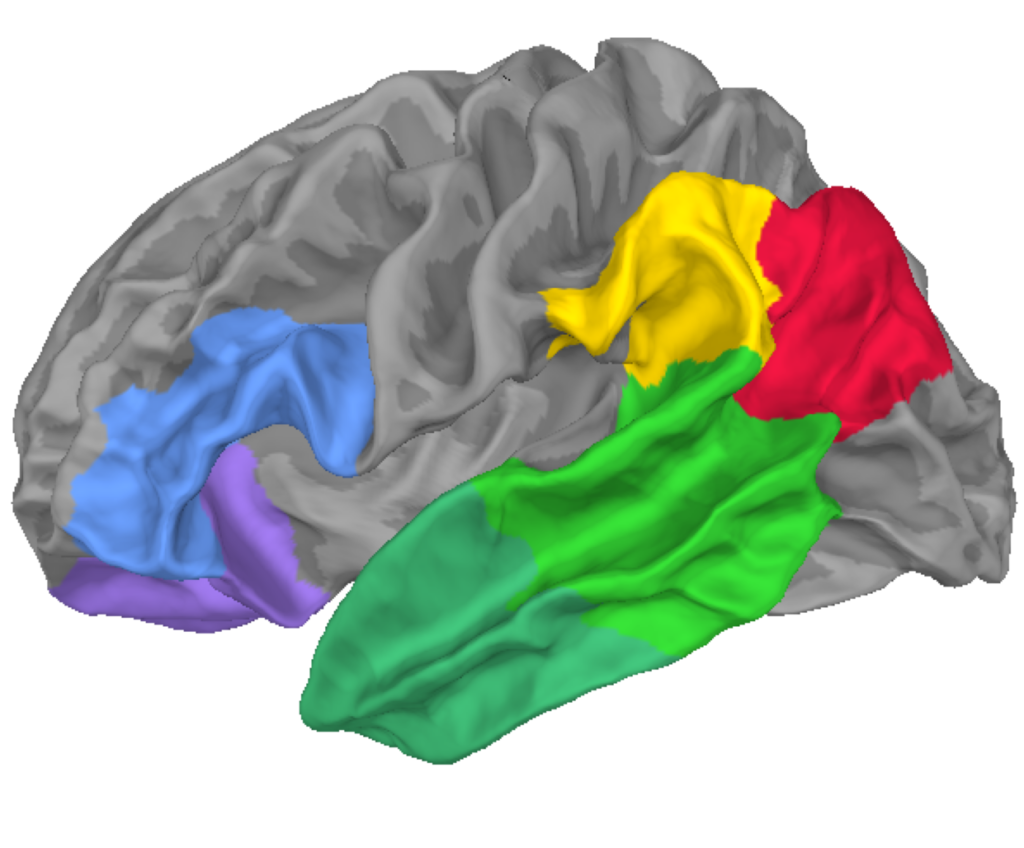
First was to select set of regions of interests (ROIs) to analyse. This means that we select the signals in these regions and convert them into a vector at each time point. 6 regions where chosen. These regions are known to be important for language processing (Language Network).
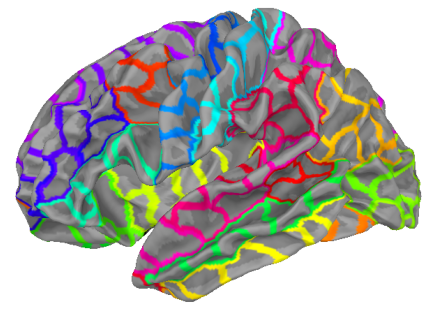
The second approach was to use whole brain analysis. What this means is that brain signal was segmented into many small regions and analysis was performed for each segment in much the same way as before.
3. Artefact Removal
Muscle artefacts need to be removed. This detail is not necessary to understand the results. Read more.
4. Results
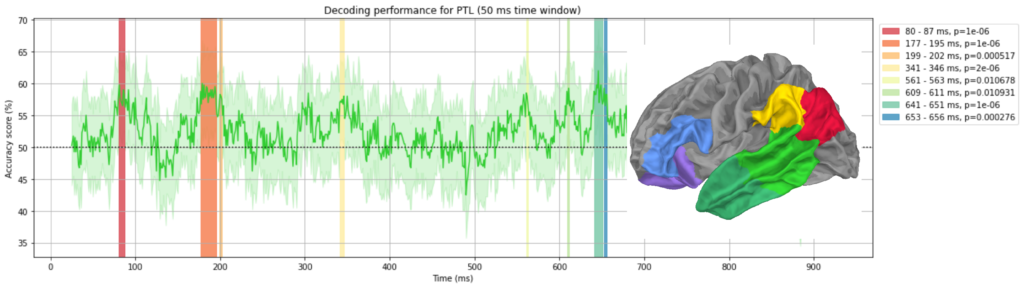
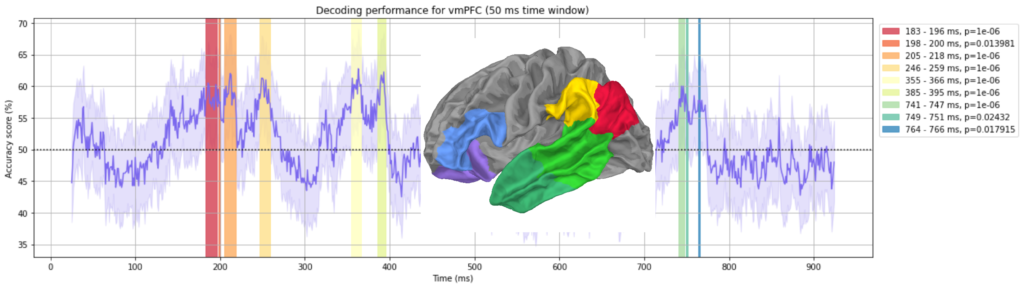
4.1. ROIs Analysis Results
Following graphs show the decoding performances for each region of interest. Shaded regions show where the performance reached statistical significance threshold.
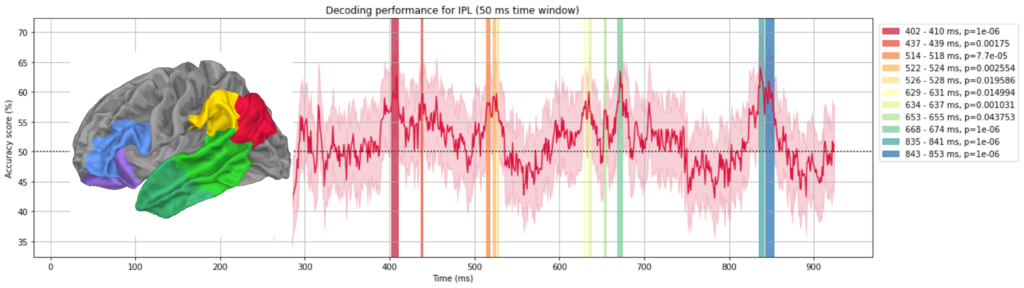
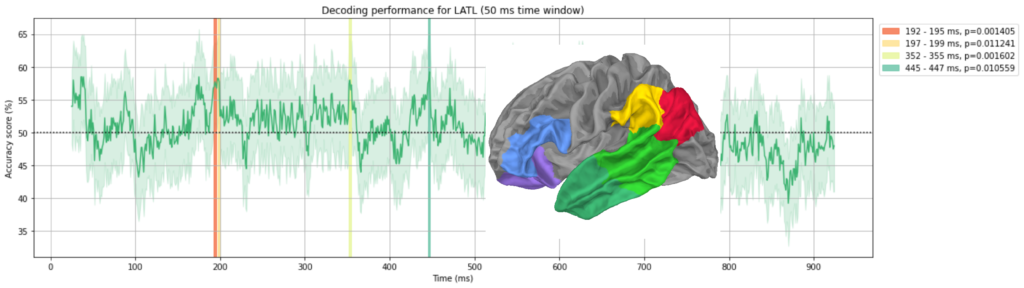

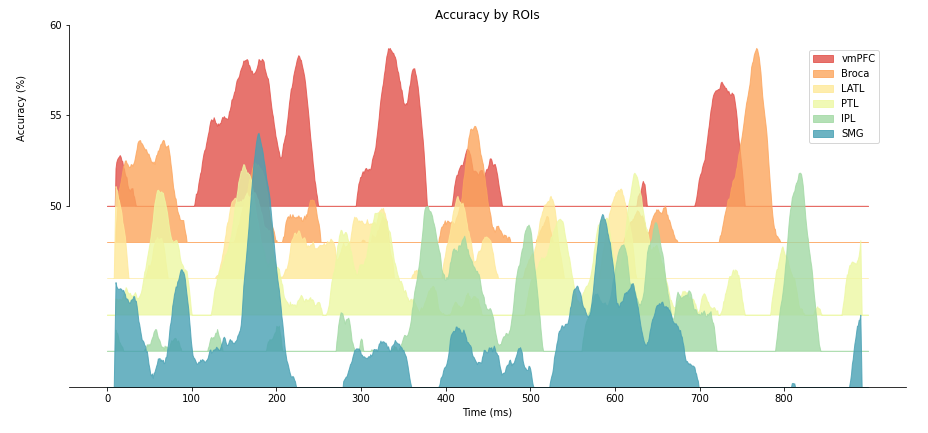
Summary of graphs above can be shown in a ridgeline plot. You can see few “clusters” of significant decoding. We will discuss this below.
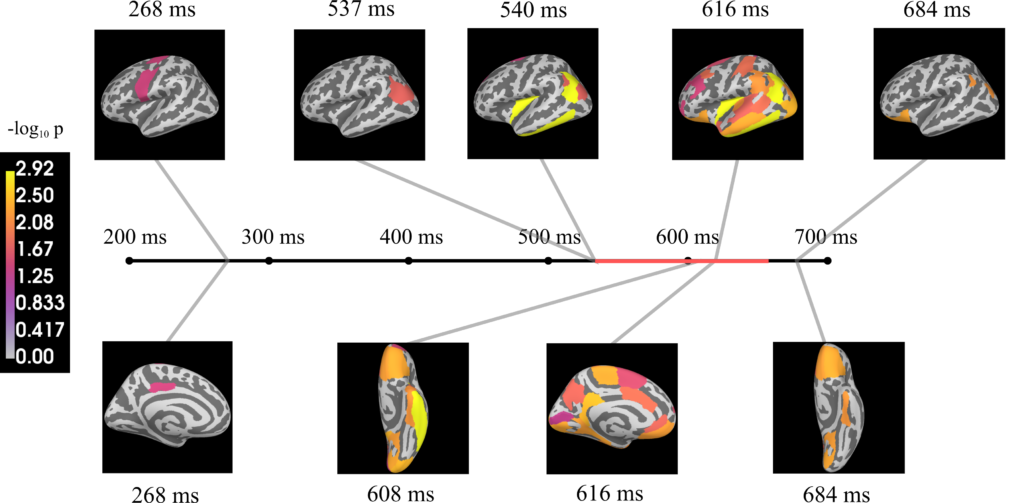
Whole Brain Analysis
The whole brain analysis shows a slightly different picture. It seems that much wider regions contain information about phrases than ROI analysis would suggest. There seems to be a large cluster of activities around 600 ms.
5. Discussion
We cannot conclude much from this small dataset but we can speculate a few things.
We can see that much of peaks can be organised into four sections: at 200 ms, at 400 ms, at 600 ms and around 700-900 ms.
At each time window different parts of the brain seem to be involved (see below).

Remember we had two models to take predictions from? The red area at the front of the brain corresponds to what was predicted by Pylkkänen. The yellow and light green areas at the back corresponds to the predictions made by Friederici. So it seems both models were half right.
Also, we observed activities outside these areas. This suggests that predictions were too simplistic and need incorporate more regions.
Unfortunately, analysis like this can only reveal what, not why. We are very far from understanding why these different areas activate at different rates and what their roles are.
A. Reference
Strijkers, K., Chanoine, V., Munding, D., Dubarry, A. S., Trébuchon, A., Badier, J. M., & Alario, F. (2019). Grammatical class modulates the (left) inferior frontal gyrus within 100 milliseconds when syntactic context is predictive. Scientific reports, 9(1), 1-13.